Claude builds live data dashboards from plain-language questions
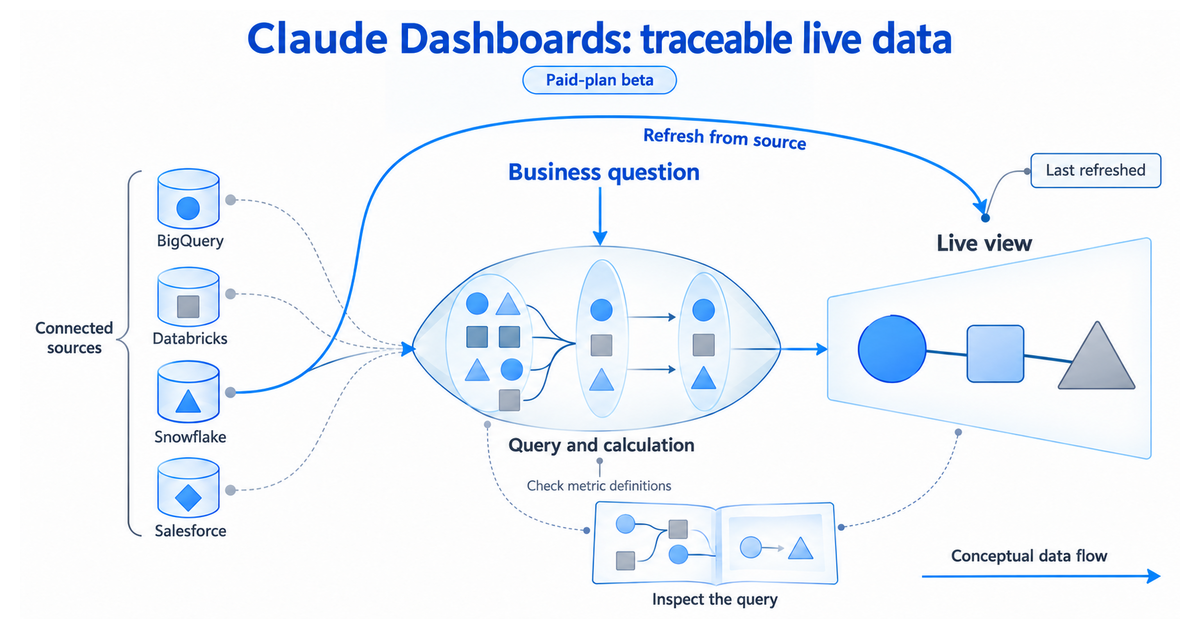
Anthropic introduced Claude Dashboards in paid-plan beta as a way to turn an ordinary business question into a dashboard connected to the underlying data. Supported examples include data warehouses such as BigQuery, Databricks and Snowflake and customer systems such as Salesforce. The displayed result is intended to remain current as the source updates, so an analysis can be revisited rather than frozen as a screenshot. The strongest reader value lies in the visible path from question to chosen data, query or calculation, chart, and latest refresh. The announcement also introduces Claude Motion, a separate beta capability for animated explainers, and makes Docs, Slides and Design available beyond beta. Those features have different eligibility; Motion is specifically Team and Enterprise beta. A live dashboard still needs the ordinary protections of any business-intelligence system: source ownership, calculation checks, access control, freshness indicators and an opportunity to challenge the chart.
Claude builds live data dashboards from plain-language questions
Focus: Agents for Everyone Date: October 8, 2026 Topics: live dashboards, data source provenance, business questions, refresh controls Evidence: Publisher Authored Availability: Available
Summary: Anthropic introduced Claude Dashboards in paid-plan beta as a way to turn an ordinary business question into a dashboard connected to the underlying data. Supported examples include data warehouses such as BigQuery, Databricks and Snowflake and customer systems such as Salesforce. The displayed result is intended to remain current as the source updates, so an analysis can be revisited rather than frozen as a screenshot. The strongest reader value lies in the visible path from question to chosen data, query or calculation, chart, and latest refresh. The announcement also introduces Claude Motion, a separate beta capability for animated explainers, and makes Docs, Slides and Design available beyond beta. Those features have different eligibility; Motion is specifically Team and Enterprise beta. A live dashboard still needs the ordinary protections of any business-intelligence system: source ownership, calculation checks, access control, freshness indicators and an opportunity to challenge the chart.
Why it matters: A good first use is a low-risk recurring metric review. Ask for one live dashboard over a trusted dataset, inspect the metric definition and filters, then make one known data change and confirm the refresh behaves correctly. The product may simplify dashboard creation; it cannot replace the judgment needed to decide whether the underlying metric is meaningful.